IQ0 Line Art
|
|
Cannot be edited
|
Can be edited
|
|
TASK
|
.pdf
|
.doc
|
|
Teacher notes
|
.pdf
|
.doc
|
|
Summary
Student will graph a picture. Find the domain of the line segments of the picture are drawn. Then graph line segments with fixed domain. Then students color in the picture and rewrite the linear functions as inequalities that match the shading. They use technology to check their line segments and inequalities.
|
Language:
domain and range
one variable inequality
linear function
|
|
Differentiation

|
All students
|
# 1 – 5
|
Review of prior learning but in new context.
-
Domain and range
-
graph lines
|
|
#6 – 7
|
Write equations of inequalities.
|
|
Most students
|
# 8
|
Create their own picture.
|
Grouping: Individual
Formative Assessment:
|
#5 & 7
|
Students self assess
|

|
W
hat to bring out in the Debrief:
|
Common Core Standards
|
Systems of Equations Learning Targets
|
|
Practice 6. Attend to precision.
|
|
|
A-REIc I can represent and solve equations and inequalities graphically.
|
|
A-REI.12 Graph the solutions to a linear inequality in two variables as a half-plane (excluding the boundary in the case of a strict inequality), and graph the solution set to a system of linear inequalities in two variables as the intersection of the corresponding half-planes.
|
|
BIG Idea:Students will be able to graph data, find a function that best fits data, find and interpret correlation coefficient, graph residual plots to determine if the function is the best model, and use the model to make predictions.


s
-
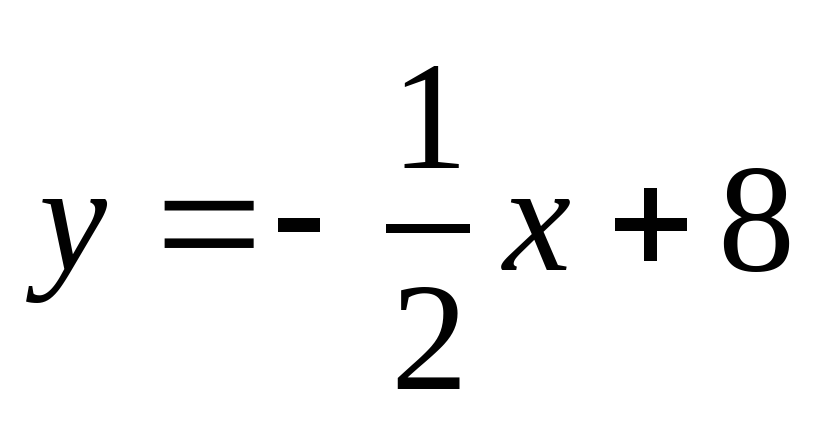
Write the linear function and domain of the line segment.
-
|
Linear Function
|
Domain
|
|
y = x + 5
|
-1 ≤ x ≤ 2
|
|

|
2 ≤ x ≤ 8
|
|
y = 4
|
-1 ≤ x ≤ 8
|
-
Color in the triangle in the interior.
What is the range of the triangle?
4 y 7
|
-
Draw the line with the given domain.
-
|
Linear Function
|
Domain
|
|
y = -1
|
-1 ≤ x ≤ 8
|
|

|
4 ≤ x ≤ 8
|
|

|
-1 ≤ x ≤ 0
|
|
y = 4
|
-1 ≤ x ≤ 8
|
-
Color in the quadrilateral in the interior.
What is the range of the quadrilateral?
-1 y 4
|
-
Use technology to check your line segments.
-
Check the triangle.
-
Check the quadrilateral.
TI -84 www.geogebra.org www.desmos.com other?
-
R ewrite the linear function as an inequality that represents the shaded region.
-
|
Linear Function
|
Inequality
|
|
y = x + 5
|
y x + 5
|
|

|

|
|
y = 4
|
y 4
|
|
y = -1
|
y -1
|
|

|

|
|

|

|
-
Use technology to check your inequalities.
-
Check the triangle.
-
Check the quadrilateral.
TI -84 www.geogebra.org www.desmos.com other?
-
Make your own design similar to mine with 12 or fewer lines. You need to turn in the directions (like the one on this page) and the drawing on graph paper.

Algebra 1 by Southwest Washington Common Core Mathematics Consortium is licensed under a Creative Commons Attribution 4.0 International License.
This page has been viewed by  viewers.
Comments (0)
You don't have permission to comment on this page.